


Certified Data Analytics Professional

Data Analytics Master Program — Excel • SQL • Python • Power BI • Tableau

Data Analytics is transforming how businesses understand performance, identify opportunities, and make informed decisions. This program equips you with practical skills in data analysis, data visualization, reporting, and business intelligence. Gain hands-on experience working with real-world datasets, building interactive dashboards, and converting raw data into meaningful business insights with guidance from industry experts.

  • Comprehensive Data Analytics Curriculum
  • Hands-on labs with real-world datasets and business scenarios
  • Data visualization, reporting, and business intelligence projects
5 months
Course Duration
Beginner to Intermediate
Course Level
Online
Course Delivery
Start Your Research Journey

Request Program Details

Speak with our admissions team about the online Doctorate in Computer Science.

Solve: 3 + 4 = ?

Program Highlights

The Data Analytics Certification Training equips learners with industry-relevant skills in Excel, SQL, Python, Power BI, Tableau, and data visualization. Gain practical experience analyzing datasets, identifying trends, creating reports, and developing interactive dashboards through real-world projects.

💻 Fully Live Program with Real-Time Interaction
🎥 Recorded Video Sessions for Your Convenience and Understanding
👨‍🏫 Industry Expert Guidance with Dedicated Help Desk Support
📄 Resume Preparation and Career Mentorship
💳 Flexible Payment Options and Manageable Installments
📞 Learner Support via Email, Chat and Call

Why Choose Data Analytics Certification Training?

Master Data Analysis, Visualization and Business Intelligence

This program helps learners develop practical skills in data cleaning, data analysis, statistical interpretation, dashboard creation, and business reporting. Learn to work with different data sources, identify meaningful patterns, and present insights that support better business decisions.

Comprehensive Curriculum
Excel, SQL, Python, Power BI, Tableau and Data Visualization Skills
Learning Access
Access to course materials, practice exercises and learning resources as per the selected program plan.
Hands-on Labs & Projects
Practice data cleaning, exploratory data analysis, report preparation, and interactive dashboard development.
Certification and Assessment
Prepare for the applicable Data Analytics certification assessment. Certification and exam inclusions should be confirmed for the selected program.
Enroll Now Course Curriculum
365
Days Lab Access
50+
Hands-On Projects
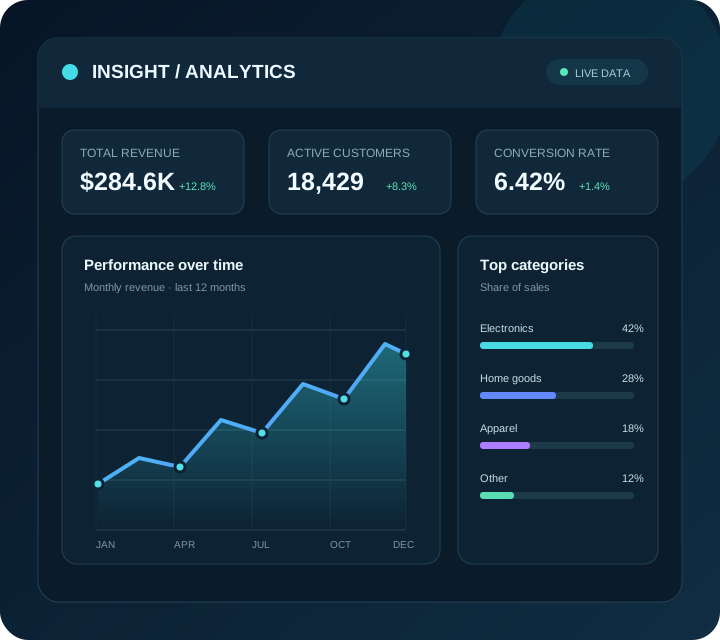
Data analytics dashboard with business intelligence charts
Data Analytics
Certification Program
Advanced Training
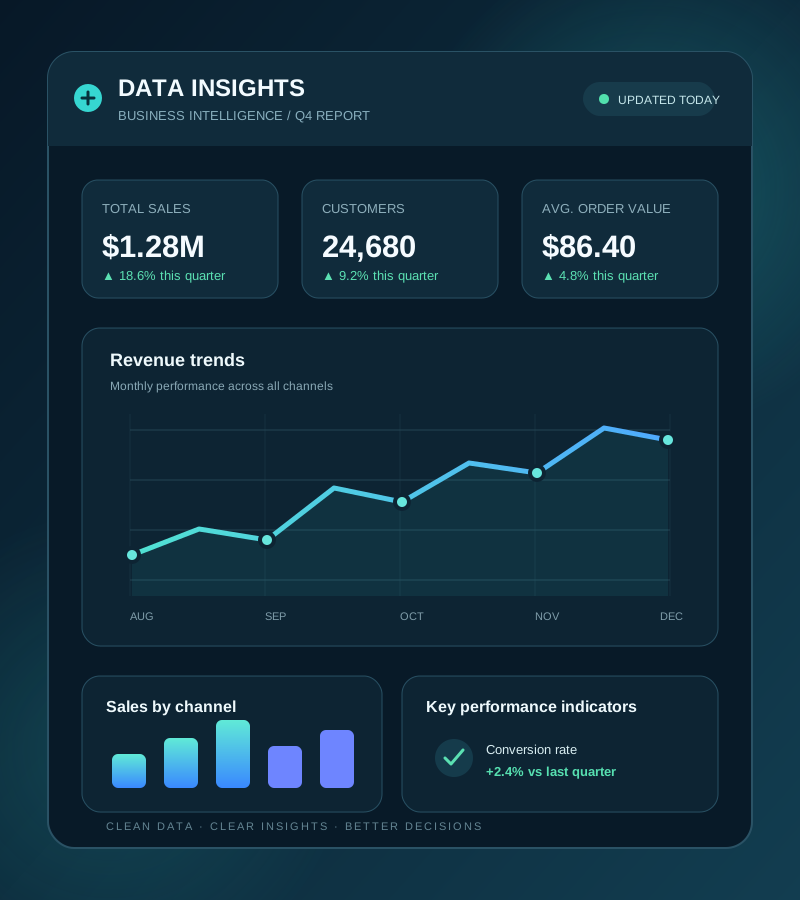
Data analytics dashboard showing trends and key performance indicators

Data Analytics Certification Training

This program equips learners with practical skills in data analysis, data visualization, SQL, Python, and business intelligence tools. Learn to clean and organize data, analyze business performance, identify trends, and create dashboards that communicate insights effectively.

Develop the skills required to pursue opportunities in data analytics, reporting, and business intelligence across industries such as IT, finance, healthcare, retail, e-commerce, and consulting.

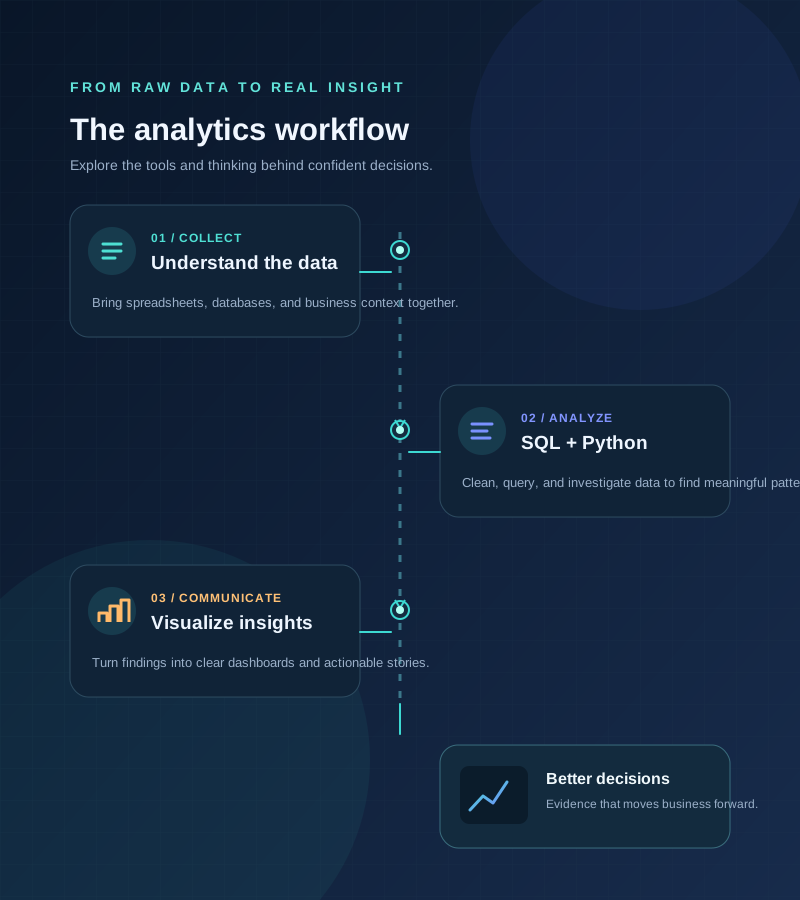
Data analysis workflow with SQL, Python, and data visualizations
Program Level

What You Will Learn

1️⃣ Data Analytics Foundations
  • Understanding data analytics concepts, data types, and data sources
  • Introduction to descriptive statistics and analytical thinking
  • Data collection, organization, and interpretation
  • Understanding business requirements and analytical questions
  • Identifying trends, patterns, and key performance indicators (KPIs)
Excel for Data Analysis
  • Data cleaning, formatting, sorting, and filtering
  • Formulas and functions for data analysis
  • PivotTables and PivotCharts
  • Lookup functions and conditional formatting
  • Creating reports and analyzing business performance
SQL and Database Analysis
  • Understanding relational databases and tables
  • Writing SQL queries to retrieve and filter data
  • Using WHERE, GROUP BY, ORDER BY, and JOIN operations
  • Aggregate functions and subqueries
  • Analyzing structured datasets using SQL
Python for Data Analytics
  • Python fundamentals for data analysis
  • Working with NumPy and Pandas
  • Data cleaning, transformation, and manipulation
  • Exploratory data analysis
  • Creating visualizations using Matplotlib and Seaborn
Power BI and Tableau
  • Connecting and importing data from different sources
  • Data transformation and preparation
  • Creating interactive dashboards and reports
  • Building charts, graphs, and KPI visualizations
  • Developing business intelligence reports
  • Presenting analytical findings through visual storytelling
Hands-on Projects and Career Preparation
  • Sales and revenue performance analysis
  • Customer behavior and segmentation analysis
  • Financial and business performance reporting
  • E-commerce data analysis
  • Dashboard development using Power BI or Tableau
  • Portfolio projects, resume preparation, and interview practice

Core Traits You’ll Build

Analytical Thinking Attention to Detail Problem-Solving Data Interpretation Business Communication

Your Analyst Style

Develop a practical, data-driven approach to solving business problems. Learn to analyze datasets, identify patterns, create meaningful visualizations, and communicate actionable insights that support informed decision-making.

Data Analytics Certification

Validate your knowledge of data analysis, reporting, and visualization through the applicable Data Analytics certification pathway. Build practical experience with datasets, analytical tools, and business intelligence projects to demonstrate your skills to potential employers.

Data Science Certificate

Become a Certified Data Analytics Professional

Develop the analytical and technical skills required to work with business data, prepare reports, build dashboards, and support data-driven decisions.

  • Master Data Analysis, SQL and Excel
  • Gain Hands-on Experience with Python and Data Visualization
  • Develop Interactive Dashboards Using Power BI and Tableau
  • Learn to Interpret Data and Present Business Insights
  • Build Practical Projects for Your Professional Portfolio
  • Prepare for Data Analytics Roles Across Multiple Industries

Tools & Technologies Covered

Microsoft Excel

Data cleaning, formulas, pivot tables, and reporting.

SQL & Databases

Query, filter, join, and analyze structured datasets.

Python

Automate analysis and explore data using libraries.

Power BI

Create interactive dashboards and business reports.

Tableau

Visualize trends and communicate analytical findings.

Pandas

Clean, manipulate, and analyze datasets with Python.

NumPy

Perform numerical calculations and array-based analysis.

Statistics

Apply descriptive and inferential statistics to identify patterns, test hypotheses, and draw reliable conclusions from data.

Data Analytics Certification Training

Data Analytics is an essential part of modern business decision-making. Organizations use data to understand customer behavior, monitor performance, improve operations, identify market trends, and make strategic decisions.

This program helps learners develop practical expertise in data preparation, statistical analysis, SQL, Python, data visualization, and business intelligence.

Learn how to transform raw data into useful information, create clear reports, and present findings that help businesses make informed decisions.

Businesses across industries rely on data to measure results, understand market trends, and improve operational efficiency. This program helps you build the technical and analytical skills needed to work with data and explore opportunities in analytics and business intelligence.

Work with practical datasets and business case studies involving sales performance, customer behavior, financial reporting, operational metrics, and market analysis. Apply your knowledge to data cleaning, exploratory analysis, dashboard creation, and insight generation.

Build skills relevant to roles such as Data Analyst, Business Intelligence Analyst, Reporting Analyst, Junior Business Analyst, and Power BI Developer, depending on your experience and technical proficiency.

Student Testimonials

Illustrative sample testimonials for the Data Analytics course

Rahul Sharma

Lokesh Dandamudi

★★★★★

The Data Analytics course introduces key concepts in a clear, structured way. Learning about data preparation, analysis, and visualization helped me understand how raw data can be turned into useful business insights.

Lajin C P

★★★★★

The SQL and Excel topics provide a practical starting point for exploring datasets. The examples helped me understand how to organize information, identify patterns, and answer business questions with data.

user

Malle Ganesh

★★★★★

I found the Python analytics topics useful for learning data cleaning and exploratory analysis. Practicing with tools such as Pandas and NumPy helped make the concepts more approachable.

user

Alka Sajeevan P

★★★★★

The visualization lessons explain how to present findings clearly. Building charts and dashboards helped me see how data storytelling can support better business decisions.

user

Sreelakshmi Suresh

★★★★★

The project topics bring together analysis, reporting, and dashboard development. They provide a useful outline for building a portfolio and practicing skills used in data analytics roles.

Trusted by Learners

Discover what our learners think about us

Frequently Asked Questions

This program is suitable for students, graduates, working professionals, business professionals, and beginners who want to develop skills in data analysis, reporting, and visualization. It can also help professionals who want to transition into data analytics or improve their ability to work with business data.

The program can cover the following topics:
  • Data Analytics Fundamentals
  • Microsoft Excel for Data Analysis
  • SQL and Database Queries
  • Python for Data Analytics
  • Data Cleaning and Data Preparation
  • Statistics and Exploratory Data Analysis
  • Data Visualization and Reporting
  • Power BI and Tableau
  • Real-World Projects and Business Case Studies

No advanced technical background is necessary to begin learning the fundamentals. Basic computer skills and an interest in working with data are helpful. Familiarity with mathematics or spreadsheets can be beneficial, but the required prerequisites depend on the selected course level.

The course duration and delivery format depend on the selected training program. Online learning may include instructor-led sessions, recorded lessons, practical exercises, assignments, and project-based learning. Contact Securium Academy for the confirmed schedule and duration.

Assessment requirements depend on the certification provider. Depending on the program, assessment may include multiple-choice questions, practical assignments, data analysis exercises, dashboard projects, or case studies. Confirm the applicable exam format before enrollment.

The curriculum may include:
  • Microsoft Excel
  • SQL and relational databases
  • Python
  • Pandas and NumPy
  • Matplotlib and Seaborn
  • Microsoft Power BI
  • Tableau
  • Jupyter Notebook
The final list depends on the selected training package.

The Data Analytics Certification Training fee depends on the selected course, training format, learning resources, and certification inclusions. Contact Securium Academy for the latest course fee and available payment options.

After developing the relevant skills and practical experience, learners may pursue opportunities such as:
  • Data Analyst
  • Junior Data Analyst
  • Business Intelligence Analyst
  • Reporting Analyst
  • Business Analyst
  • Power BI Developer
  • Data Visualization Analyst
Job eligibility and salary depend on experience, technical skills, location, and employer requirements.

Securium Academy provides training resources and expert guidance for learners interested in developing professional skills. The most suitable learning format depends on your background, schedule, and career goals. Contact the academy to confirm the available Data Analytics program, delivery format, and learning support.

The proposed curriculum includes practical exercises and project ideas involving sales analysis, customer behavior, business performance, and dashboard development. Confirm the final project list and practical training inclusions with Securium Academy before publishing.

Certificate eligibility depends on the selected program and its completion requirements. Confirm whether the course includes a certificate of completion, an external certification assessment, or both.

Yes. Beginners can start with Excel, basic statistics, and data interpretation before progressing to SQL, Python, and dashboard development. Regular practice with datasets and practical projects helps learners build confidence and develop job-relevant skills.

Request More Details

Solve: 3 + 4 = ?
Enter the result of the math question above.
×

Book Demo

×

Connect With Expert

Solve: 3 + 4 = ?
Enter the result of the math question above.
Connect With Expert
×

Apply Now

Solve: 3 + 4 = ?
Enter the result of the math question above.
×

Apply Now

Solve: 3 + 4 = ?
Enter the result of the math question above.